Invisible Does Not Mean Unmappable
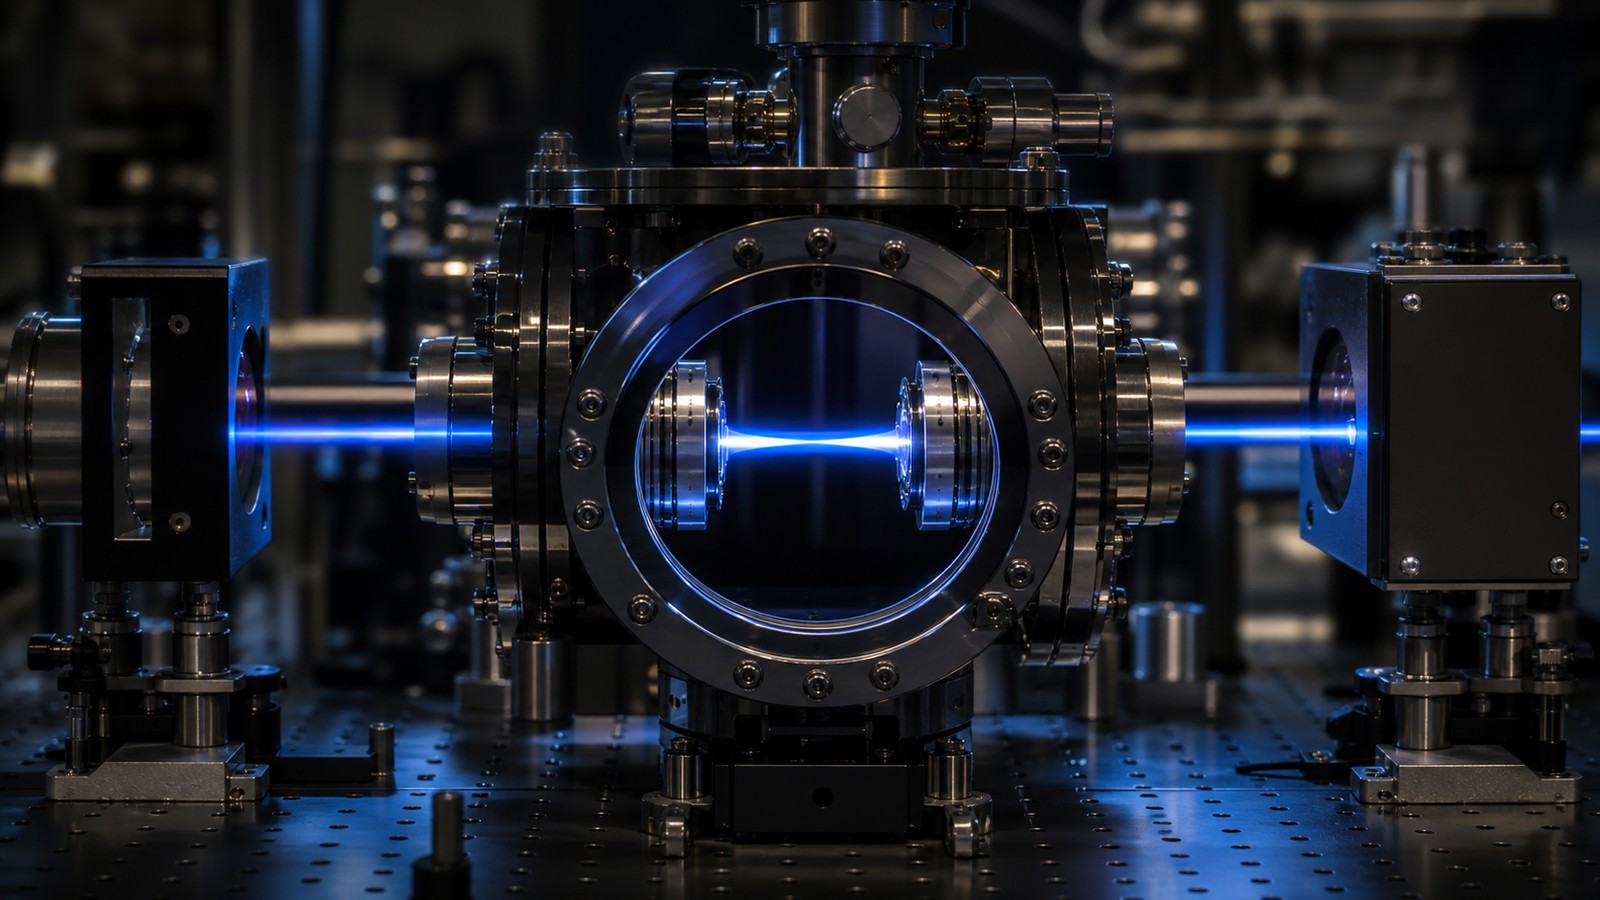
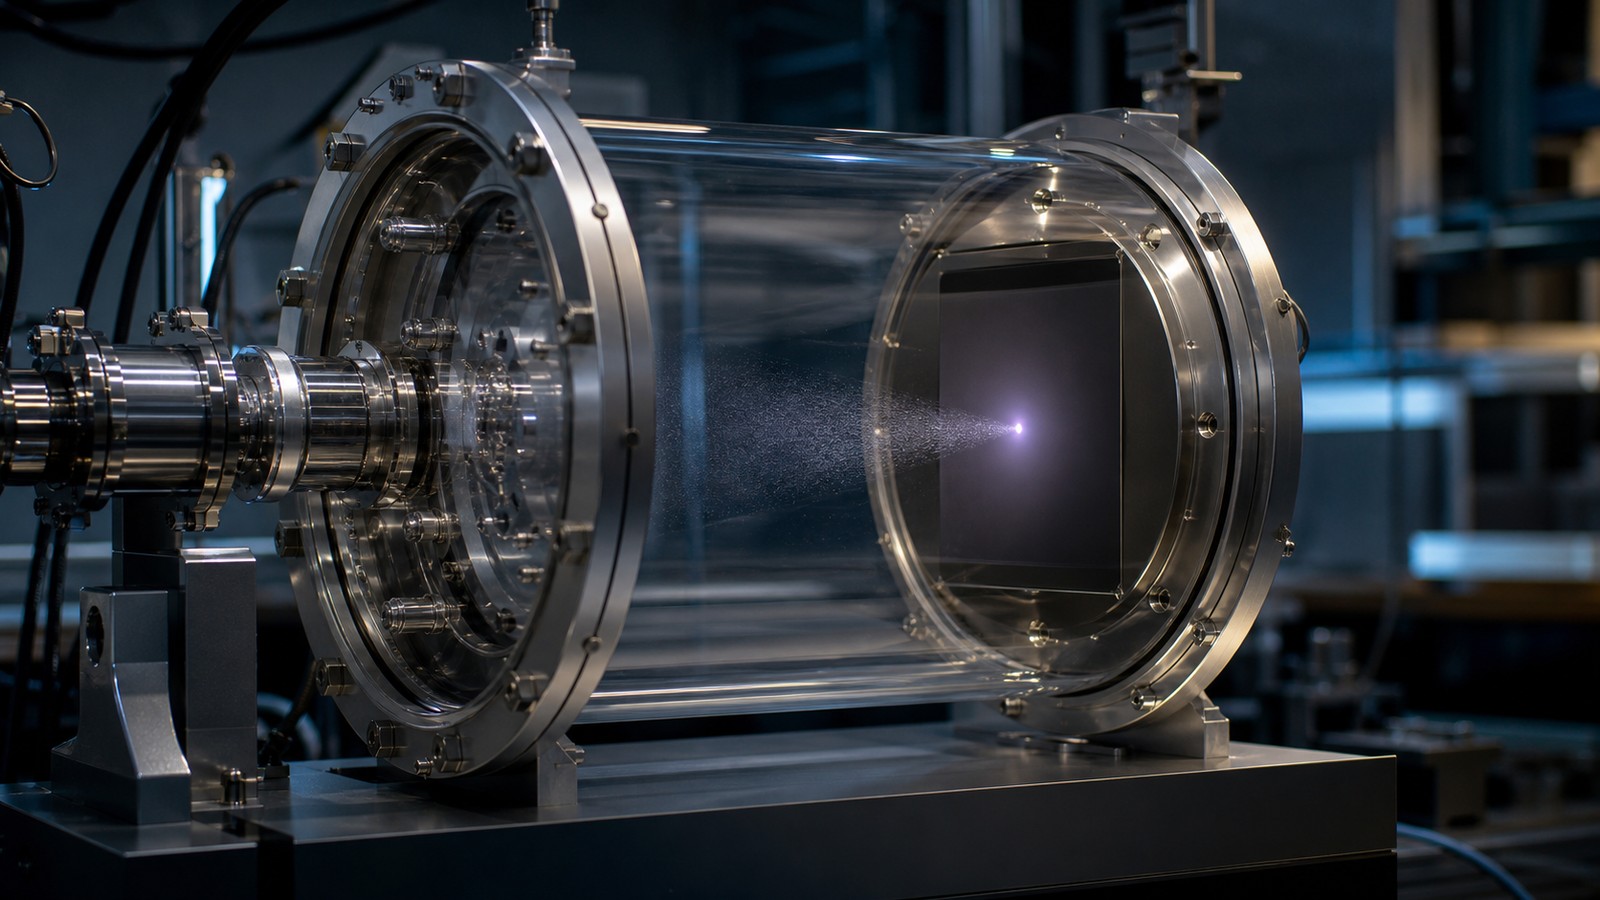
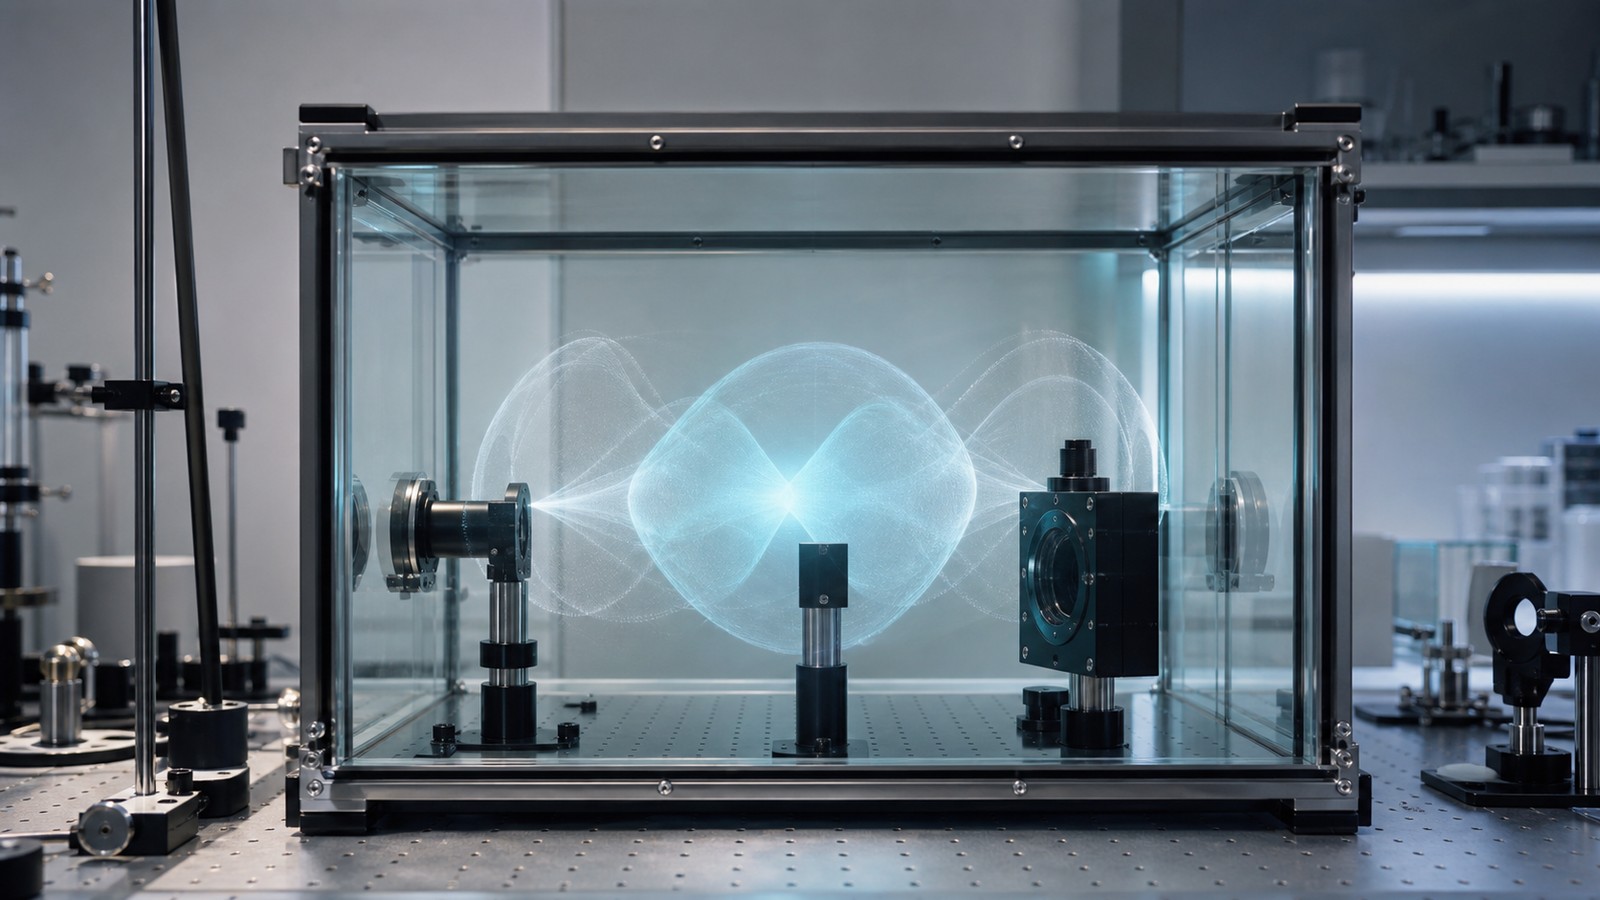
Scientists visualize quantum uncertainty by turning invisible state information into maps, distributions, and reconstructed patterns. These images are not simple photographs of tiny objects. They are visual summaries of what repeated measurements, mathematical models, and state reconstructions say about possible outcomes. A probability cloud, an orbital shape, an interference pattern, or an error bar can all make uncertainty visible in different ways. The key is to read each image for what it actually represents. A good visualization clarifies the measurement question instead of pretending that uncertainty has been directly photographed.
A: Not directly. They map patterns linked to measurements.
A: A visual summary of where outcomes are more likely.
A: They are state-based probability visualizations, not travel photos.
A: Repeated records reveal distributions that one event cannot show.
A: It reconstructs state information from many measurement settings.
A: Usually color encodes a chosen quantity rather than real microscopic color.
A: They show confidence and remaining uncertainty in reported values.
A: Often indirectly through interference or later probability changes.
A: Ask what property the image represents.
A: A clear link between data, method, and measurement context.
Why Visualization Is Tricky
Quantum uncertainty is hard to draw because it is not a hidden blur sitting in ordinary space for every property at once. It belongs to a state and a measurement context. A picture that works for position may not work for momentum, spin, or phase.
That is why quantum visuals need captions in the scientist’s mind, even when the image itself is clean. The viewer has to know what is being mapped and how the map was obtained.
Without that context, a helpful picture can quickly become a misleading icon.
Probability Maps Are Not Photographs
A probability map shows where outcomes are likely to appear. It does not show a particle smeared like colored ink. The map may be built from calculations, repeated detections, or reconstructed state information.
Reading it as a photograph creates confusion. The detector still records definite events, while the map describes the distribution those events follow over many trials.
How Repeated Measurements Build Images
Many quantum images are built from repetition. A single detection gives one record. Thousands or millions of records can reveal a distribution, interference pattern, decay curve, or correlation structure.
This makes the invisible visible statistically. The pattern is not guessed into existence. It is assembled from controlled preparation, consistent measurement, and careful data analysis.
The image becomes evidence because it survives repetition.
Why Orbitals Became Famous
Orbitals are among the best-known visualizations of quantum uncertainty. They show where an electron is likely to be found around an atom, and their shapes help explain chemistry. The lobes and nodes are meaningful.
They are also easy to misunderstand. An orbital is not a snapshot of an electron’s travel route. It is a probability-density representation for a state.
How Error Bars Tell A Different Story
Error bars visualize uncertainty in measured values, but not all error bars mean the same thing. Some reflect ordinary measurement noise. Some reflect statistical spread. Some include quantum limits or counting uncertainty.
A good graph makes those distinctions clear in the method, even if the visual mark is only a small line. The mark says how much confidence belongs to the reported value.
That kind of uncertainty is less glamorous than an orbital, but it is central to real science.
How Tomography Reconstructs States
Quantum state tomography uses many measurements on similarly prepared systems to reconstruct information about a state. It is not a single peek behind the curtain. It is an inference built from a coordinated set of measurement results.
The reconstructed image can be useful, but it inherits limits from sample size, detector quality, noise, and the measurement choices used in the reconstruction.
How Interference Patterns Show Structure
Interference patterns are visual evidence that quantum probabilities are shaped by amplitudes, not just ordinary chances. Bright regions show where outcomes accumulate. Dark regions show where the state suppresses them.
These patterns make uncertainty feel less vague. The particle may not have a classical path, but its possible outcomes are not formless. They have structure that can be photographed through repeated records.
The pattern is the invisible logic made visible.
How Phase Gets Visualized Indirectly
Phase is especially hard to picture because it is not usually seen in one direct measurement. Scientists visualize it through interference, oscillations, rotations on state diagrams, or changes in later probabilities.
This indirect quality matters. Some of the most important parts of a quantum state are visible only through what they cause when alternatives recombine.
Why Color And Shape Can Mislead
Colorful quantum images can make the subject approachable, but color choices often represent mathematical values, probability strength, or phase convention. They are not necessarily literal colors in the microscopic world.
Shapes can mislead too. A smooth surface may look like a physical object when it is really a graph. A lobe may look like a container when it is really a region of likelihood.
The image is an interface between mathematics and intuition.
How Scientists Keep Visuals Honest
Scientists keep visuals honest by linking them to methods. They say what was measured, how many trials were used, which model was fitted, and what uncertainty remains. The picture is strongest when the route from data to image is traceable.
This is why serious scientific visuals are often less dramatic than popular images. They include calibration, scale, confidence, and limits behind the scenes.
How Beginners Should Look
A beginner should ask three questions when seeing a quantum uncertainty image. What property is being visualized? Was it calculated, measured directly, or reconstructed from many measurements? What would a single trial actually record?
Those questions prevent the most common mistake, which is turning every map into a literal object. They also make the picture more useful, because the viewer can connect it to experiment.
The goal is not to distrust visuals. It is to read them with the right kind of attention.
Why Pictures Need Provenance
A quantum picture needs provenance: where did it come from, what data support it, and what quantity does it represent? Without that chain, a beautiful visualization can be mistaken for a literal object.
Provenance turns an image into evidence. It connects the visual surface to preparation, measurement, modeling, and uncertainty estimates.
How Raw Data Becomes A Map
Raw data usually arrives as counts, clicks, voltages, arrival times, or detector positions. Scientists clean the data, remove known backgrounds, account for instrument response, and compare the result with a model.
The final map may look smooth, but the route to it is often statistical. A polished probability surface can be built from many discrete records and a careful reconstruction method.
This is why the viewer should not confuse smoothness with direct visibility. The image is an interpretation supported by data.
Why Multiple Views Can Be Needed
One visualization rarely captures every important feature. A position density, a momentum distribution, a phase-space representation, and an uncertainty bar can each show a different aspect of the same system.
Scientists use multiple views because quantum states are richer than ordinary pictures. The right visual depends on the question being asked.
How False Color Helps And Hurts
False color can make faint patterns readable. It can show intensity, phase, confidence, or another calculated value. Used well, color helps the eye detect structure that raw numbers would hide.
Used poorly, color can imply drama or certainty that the data do not support. A bright region may look physically glowing when it only marks a high value on a chosen scale.
That is why color should be read as a code, not as microscopic paint.
Why Error Visualization Is Not Boring
Error bars, confidence regions, and residual plots may look less exciting than probability clouds, but they are essential. They show how much trust belongs to the map and where the model may be weakest.
In precision physics, the uncertainty estimate can be as important as the central value. It tells other scientists whether a result is sharp enough to challenge a theory.
How Visualization Guides Intuition
A good visualization trains intuition by showing structure without pretending to remove all abstraction. It helps readers see peaks, gaps, symmetries, spreads, and correlations that would be difficult to imagine from words alone.
The best images keep the experiment nearby. They invite the viewer to ask what a detector actually recorded and how the map was made.
That balance makes invisible quantum behavior more approachable without making it falsely simple.
How To Look Twice
Look once for the pattern, then look again for the method. The second look is where the image becomes science.
How A Good Map Shows Its Limits
A good scientific map hints at its own limits. It may include uncertainty ranges, resolution limits, confidence regions, or supporting notes in the surrounding publication. Those details tell the viewer how much weight the visual should carry.
Without limits, a map can look more certain than the data justify. In quantum physics, where many images are reconstructed or statistical, that extra caution is especially important.
Why Reconstructed Does Not Mean Fake
Reconstructed images are sometimes misunderstood as less real. In science, reconstruction can be a powerful method when the process is transparent and the data are strong. Medical scans, astronomy images, and quantum state maps all depend on inference.
The key is traceability. The viewer should be able to connect the image to measurements and assumptions. When that chain is clear, a reconstructed quantum visual can be a serious scientific object.
That makes the invisible map useful without pretending it is a direct snapshot.
The Practical Visualization Lesson
The practical lesson is to ask what the image represents, how it was built, and which uncertainty remains after the visualization.
How Visuals Can Be Compared
Visuals become more trustworthy when they can be compared across conditions. Change the preparation, measurement setting, or environment, and the map should change in a way the theory can explain. A visualization gains strength when it responds predictably.
This comparative habit is common in real research. Scientists rarely trust one beautiful image by itself. They look for controlled changes, repeated patterns, and agreement with independent measurements.
Why Invisible Does Not Mean Unverifiable
Invisible quantum features can be verified indirectly. Phase can be tested through interference. Probability density can be tested through repeated detections. Correlations can be tested through paired measurements. The map is judged by consequences.
That indirect route is not a weakness unique to quantum physics. Many sciences infer unseen structure from reliable evidence. Quantum visualization is part of that broader scientific habit.
The invisible becomes credible when the evidence behaves as predicted.
The Final Visualization Habit
Ask what would change if the visualization were wrong. A scientific map should expose itself to that kind of test.
How Visuals Help Without Replacing Math
Visuals help readers notice shape, contrast, spread, and symmetry quickly. Math supplies the rules behind those features. A good explanation lets the two work together instead of pretending one can replace the other completely.
For uncertainty, this balance is especially important. A picture can show a spread, but the calculation explains which spread is being shown and why it has that form.
The image opens the door. The method tells the reader where the door actually leads.
One Final Viewing Rule
Do not ask a quantum visualization to be a photograph if it was built as a map. Ask whether it faithfully connects data, model, and uncertainty. That question preserves the image’s value without turning it into a literal scene.
The Visualization Takeaway
Scientists map quantum uncertainty through probability patterns, repeated records, and reconstructed states.
The best visuals are not photographs of hidden facts; they are disciplined bridges between measurement and meaning.